What's in the SnapPlus Reports |

|

|
|
What's in the SnapPlus Reports |
|
|
What's in the SnapPlus Reports |
|
|
|
What's in the SnapPlus Reports |
|
|
There are five sections of reports to choose from: Nutrient Management Plan Reports, Farm Management Reports, Soil Loss, Water Quality, and Data Dump.
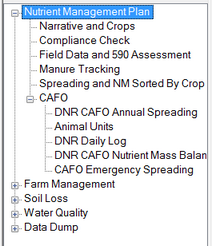
| Nutrient Management Plan Reports: This group of reports will provide all the information needed to demonstrate a compliance with the Nutrient Management Standard 590. To see how these reports will be used in plan review, see the Nutrient Management Checklist when you expand this section. |
•Narrative and Crops: Gives an overview of the farm operation by including the Farm Narrative, Concentrated Flow Channel Protection Notes, and a table showing the crops, tillage, and yields for every field in the selected year range. This report can be used to show yields over time and that planned yields are consistent with documented yields. This report also includes a table of annual acreage and production for each crop grown on the farm in the selected year range. •Compliance Check: Lists all the fields in the designated year range that have rotational soil loss or phosphorus planning problems and all that have problem manure or fertilizer applications. It identifies each problem and displays any explanations that have been entered in the Nutrient Application Planner dialog box. Soil test problems section of the report also identifies fields with soil sampling that is inadequate or out-of-date. This report set up allows the planner to identify whether the P Index or Soil Test P methods (or both) are being used for phosphorus planning, and the check will only report problems for the planning method chosen. This report also lists fields with excess N applications. For CAFOs, SWQMA spreading strategy selected in the program is listed along with a matrix that identifies whether manure is applied to a SWQMA field in a year. •Field Data and 590 Assessment Plan: Shows soil type and other field information, crops and tillage for the rotation, and rotational soil loss, P2O5 Balance and P Index values. This report can be compared to field and soil maps to determine whether soil types and field characteristics have been identified correctly. •Manure Tracking: Identifies how much manure was produced on the farm and applied or planned for application in each year of the selected year range. Also reports manure storage information and spreader calibration. This report also includes a matrix that lists acres in plan and acres receiving manure in each year of the selected year range. •Spreading and NM Sorted by Crop: Shows manure and fertilizer nutrient application rates for all fields in the selected year sorted by crop category. Identifies consistency of planned applications with UW-Extension recommendations. •CAFO: The following four reports are required by DNR for operations under WPDES permits. You do not need do run these for non-permitted operations but can if you would find the information helpful to your operation. •DNR CAFO Annual Spreading: Shows spreading information for every field. •Animal Units: Animal Units report shows animal type by size class, number of animals in each class, and animal units calculations according to NR 243, Wis. Admin. Code. Animal unit calculations are needed for determining if permits are required for Wis. Pollution Discharge Elimination System from WI DNR or through local livestock siting ordinance requirements. •DNR Daily Log: Daily log information for the selected year. •DNR Nutrient Mass Balance: Combines manure tracking and application summary reports. •CAFO Emergency Spreading: This report shows what fields on a CAFO are suitable for emergency spreading in winter.
|
|||||||||||||||||||||||||||||||||||||||||||||||||||||||||||||||||||||||||||||||||||||||
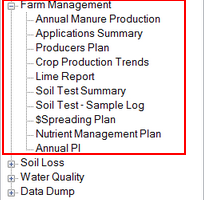
| Farm Management Reports: These are reports that are intended to be helpful to the farmer for farm management planning. They are not needed for demonstrating compliance with nutrient management guidelines. |
![]() Soil Loss Reports: These reports focus on erosion. They will all run without soil test data for a field.
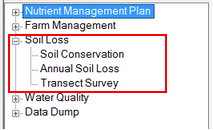
Soil Loss Reports: These reports focus on erosion. They will all run without soil test data for a field.
•Soil Conservation: Report showing rotational average Soil Loss, Sediment delivery, and Soil Conditioning Index (SCI) for each field. •Annual Soil Loss: Shows Field T, Rotational Average Soil Loss, and Annual Soil Loss in t/ac for each year over the entire rotation selected. •Transect Survey: Gives annual soil loss and is designed for those counties doing a transect survey. This report runs RUSLE2 as a sequence. Selecting the Excel format will allow you to chose to include the raw data (crops and tillages) in the report. |
•P Trade: The P Trade report is used by those participating in the DNR’s Water Quality Trading program. This computes P that is could become part of a P trade. This report runs the RUSLE2 (used for the runoff P loss calculations) as a sequence. More details about the DNR’s Water Quality Trading program can be found at http://dnr.wisconsin.gov, search for Water Quality. Note on running RUSLE2 as a Sequence: Reports that run RUSLE2 as a sequence, rather than in a rotation, will require 2 years of “startup” data before the soil loss computations will work correctly. |
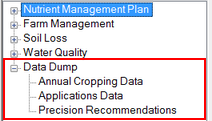
| Data Dump: These will dump data into an Excel format with not actual report generated with the Reports tool. |
•Annual Cropping Data: Clicking on this report will automatically create an excel spreadsheet that contains all the cropping data for a specific year. This is not a report, rather the raw data for creating your own report. •Applications Data: Clicking on this report will automatically create an excel spreadsheet that contains all the manure, fertilizer and lime applications data for multiple years as selected in the input form. This is not a report, rather the raw data for creating your own report. •Precision Recommendations: The Precision Recommendations data dump generates an Excel spreadsheet with P2O5, K2O and lime recommendations for each individual sample. |